样条曲线
对于一些不规则的曲线,很难用一个圆、椭圆或抛物线函数去描述,这时候,可以使用 threejs 提供的样条曲线或贝塞尔曲线去表达。
三维样条曲线 CatmullRomCurve3
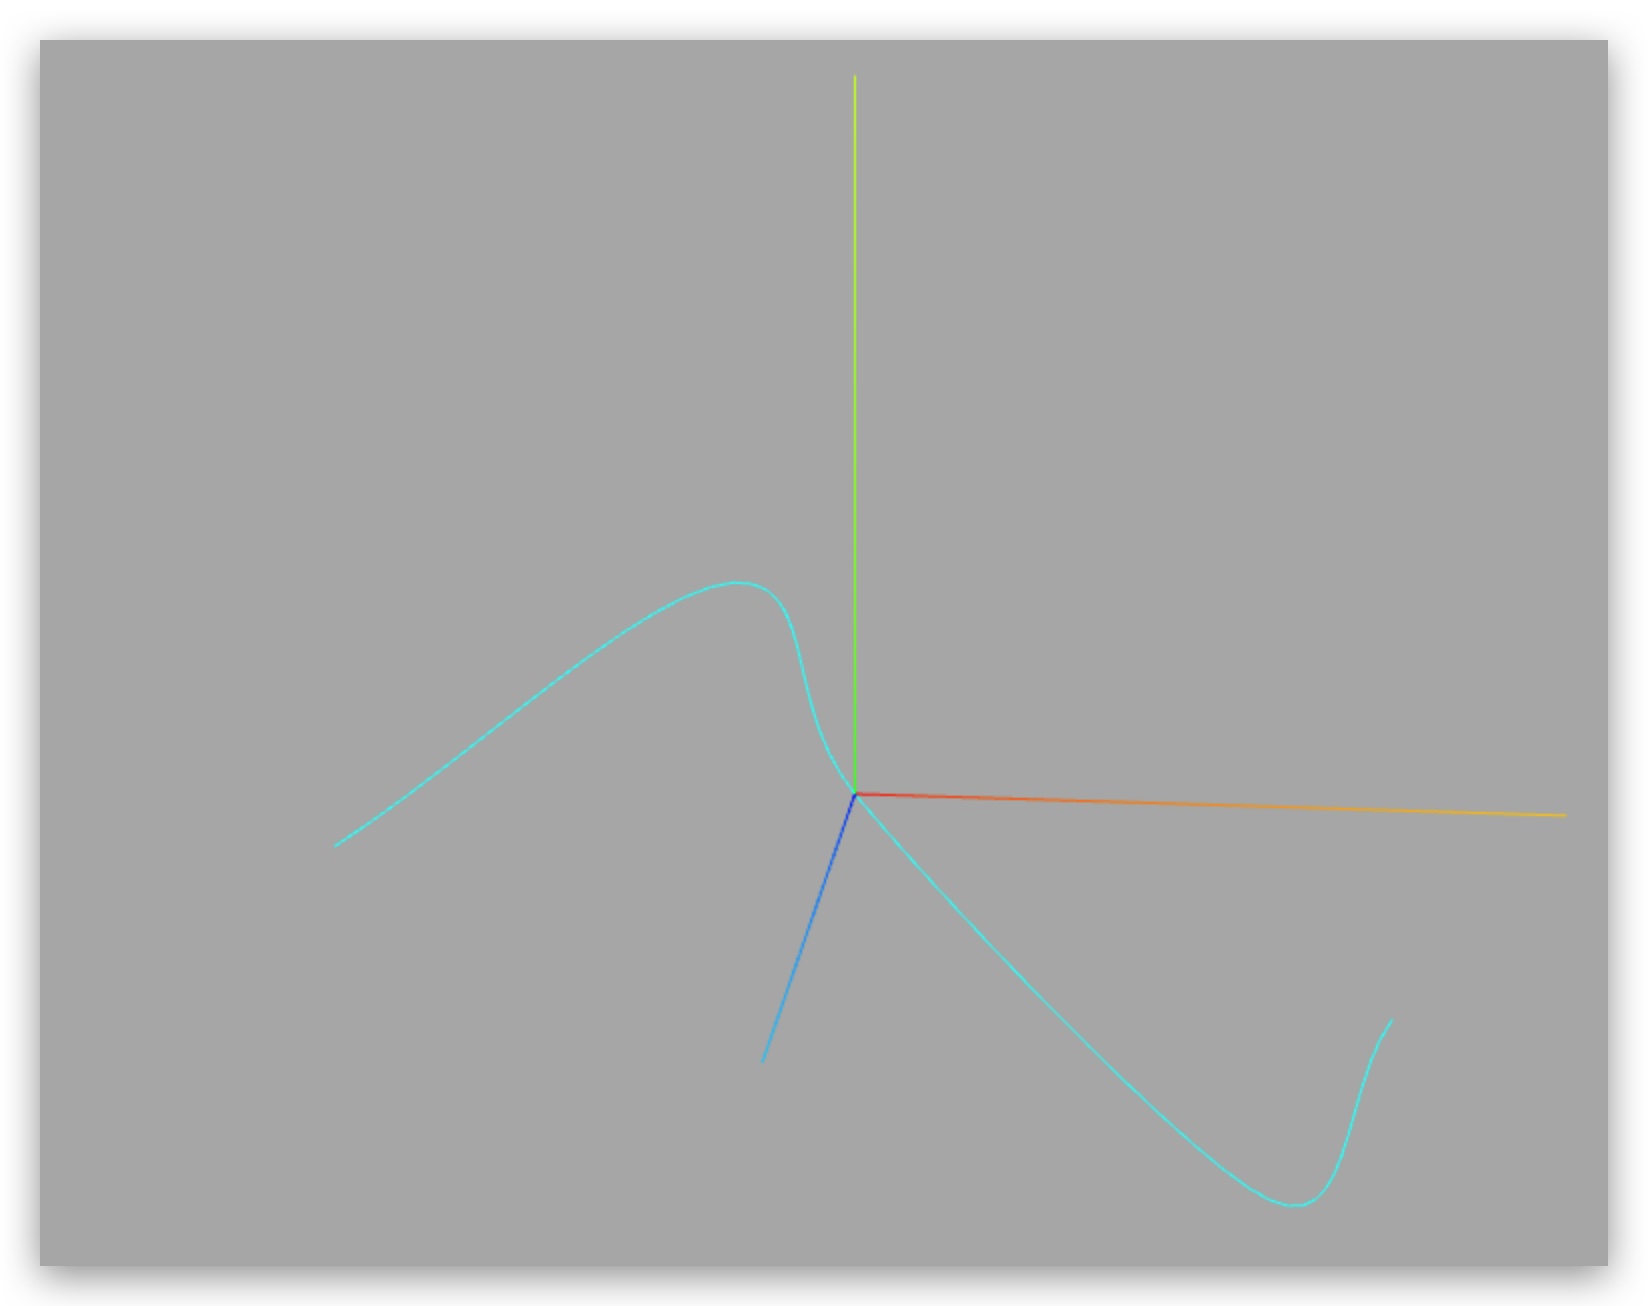
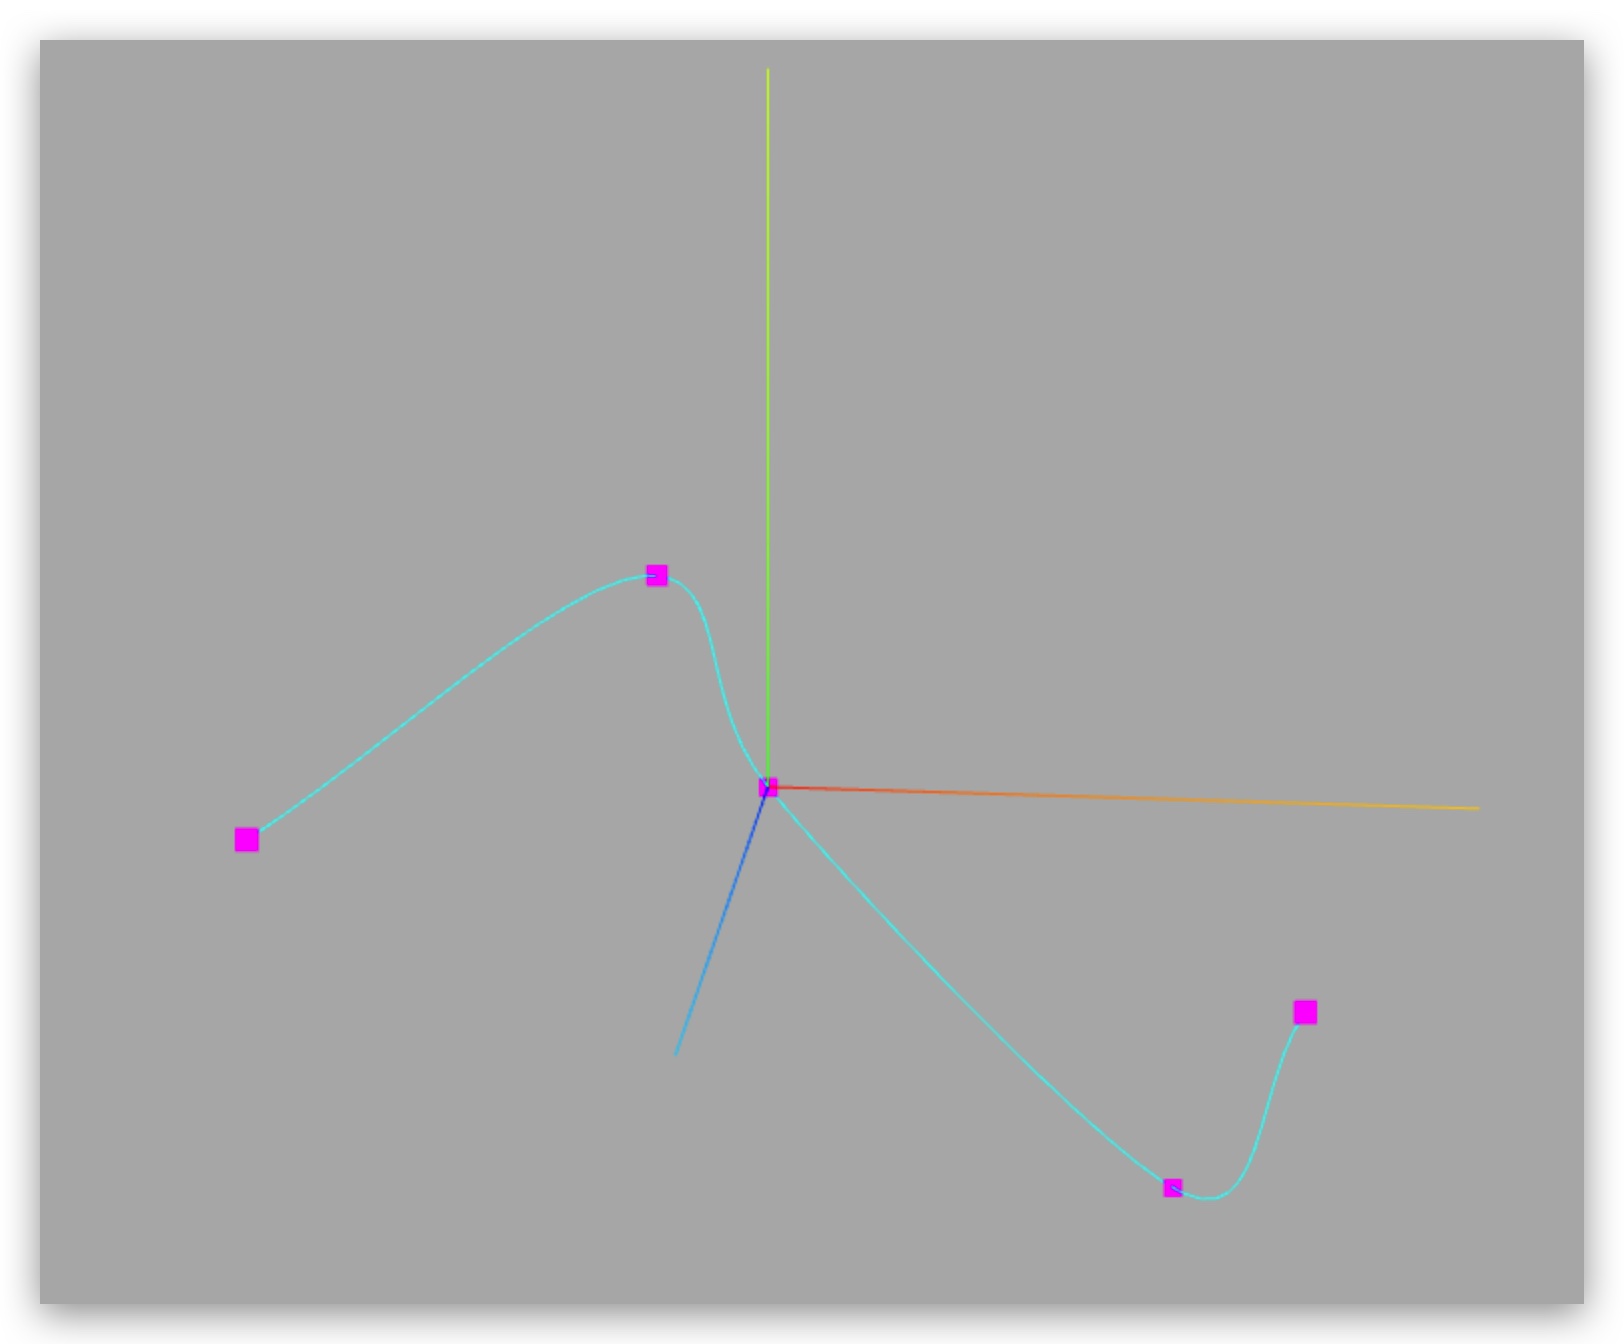
在三维空间中随意设置几个顶点坐标,然后作为三维样条曲线CatmullRomCurve3的参数,你就可以生成一条穿过这几个点的光滑曲线。
CatmullRomCurve3的参数是三维向量对象Vector3构成的数组。
从曲线获取顶点坐标,绘制线条
从曲线获取一定量顶点数据,用于绘制线模型 Line,一般来说获取顶点数量越多,渲染的曲线相对越光滑。

js
// 从曲线上获取顶点坐标
const pointsArr = curve.getPoints(50);

// 创建没有任何形状的空几何体
const geometry = new THREE.BufferGeometry();

// 把曲线上获取的顶点坐标赋值给几何体对象
geometry.setFromPoints(pointsArr);

// 创建线材质
const material = new THREE.LineBasicMaterial({
  color: 0x000000,
});

// 创建线模型
const model = new THREE.Line(geometry, material);用点模型可视化样条曲线经过的顶点位置

js
const geometryPoints = new THREE.BufferGeometry();
geometryPoints.setFromPoints(arr);

const materialPoints = new THREE.PointsMaterial({
  color: 0xff00ff,
  size: 10,
});

const points = new THREE.Points(geometryPoints, materialPoints);

const group = new THREE.Group();
group.add(line, points);2D 样条曲线
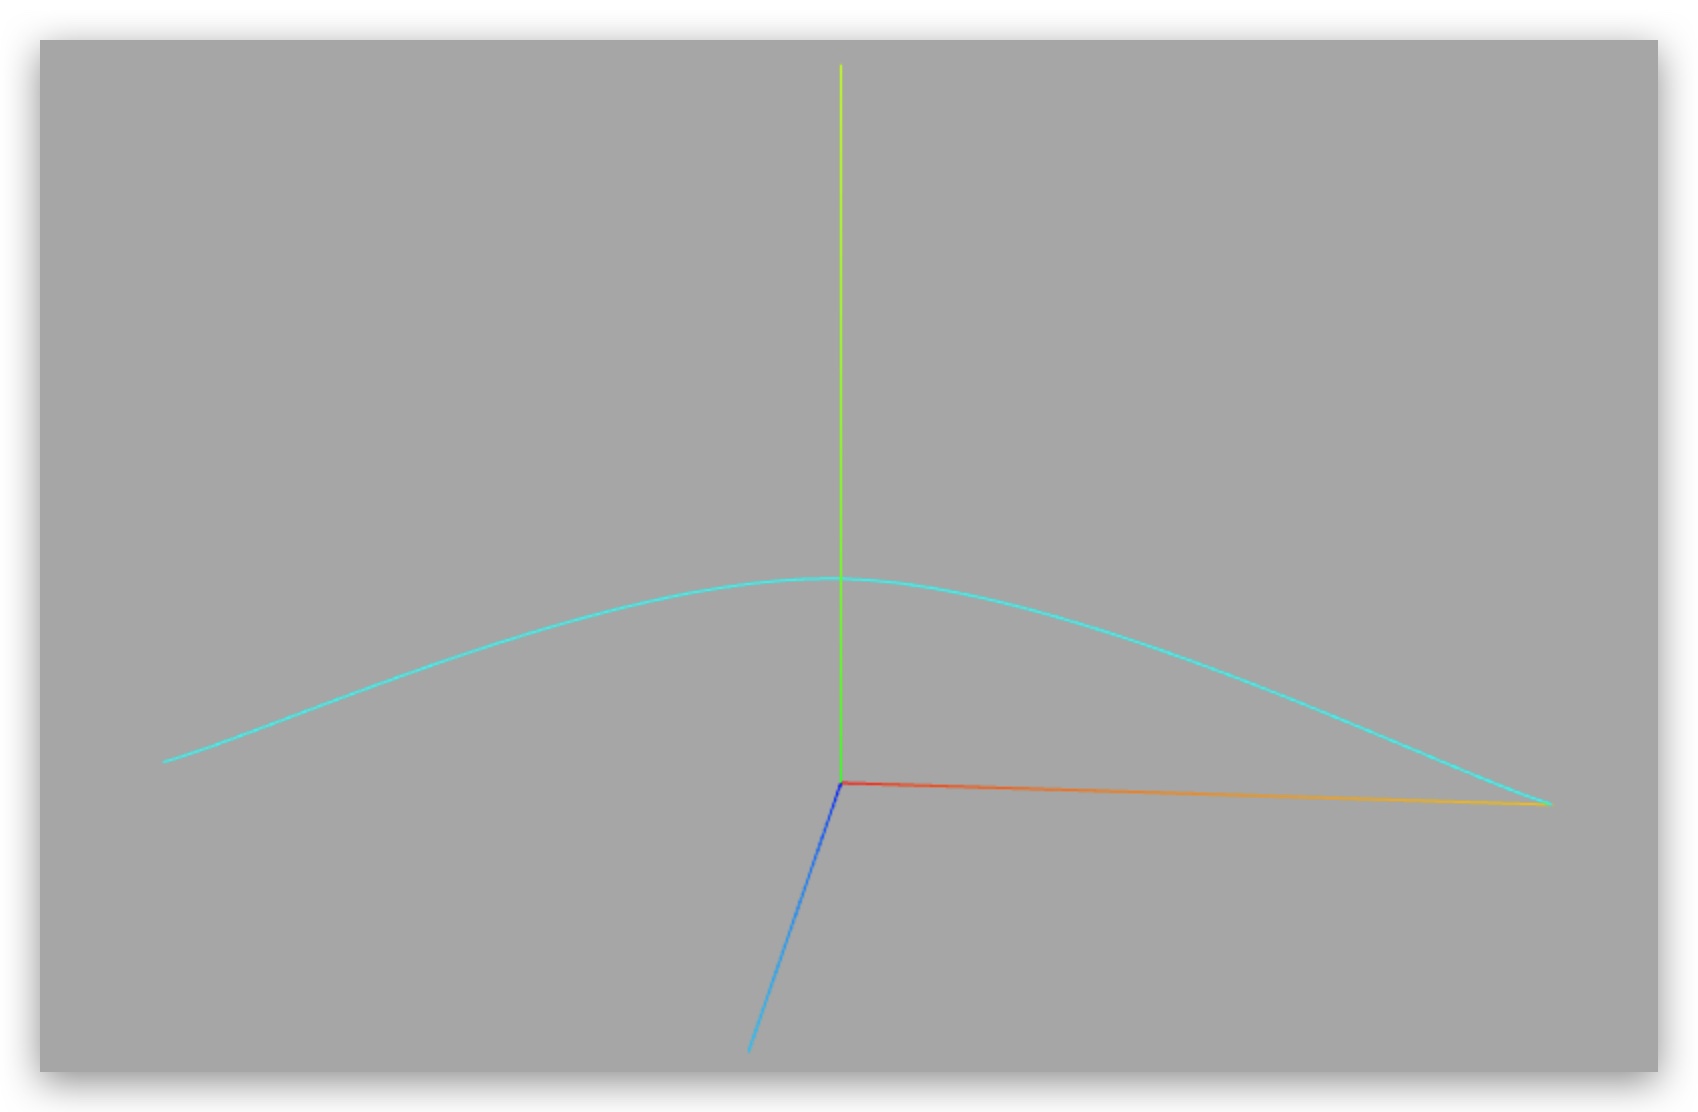
CatmullRomCurve3是 3D 样条曲线 API,曲线经过的点可以在 3D 空间中任何一个位置,二维样条曲线SplineCurve默认情况下就是在XOY平面生成一个平面的样条曲线。

SplineCurve的参数是二维向量对象Vector2构成的数组。
js
// 二维向量Vector2创建一组顶点坐标
const arr = [
  new THREE.Vector2(-100, 0),
  new THREE.Vector2(0, 30),
  new THREE.Vector2(100, 0),
];
// 二维样条曲线
const curve = new THREE.SplineCurve(arr);示例代码如下
vue
代码同 生成圆弧顶点 章节js
import * as THREE from 'three';

// 三维向量Vector3创建一组顶点坐标
const arr = [
    new THREE.Vector3(-50, 20, 90),
    new THREE.Vector3(-10, 40, 40),
    new THREE.Vector3(0, 0, 0),
    new THREE.Vector3(60, -60, 0),
    new THREE.Vector3(70, 0, 80)
];

// 创建三维样条曲线
const curve = new THREE.CatmullRomCurve3(arr);

// 二维向量Vector2创建一组顶点坐标
// const arr = [new THREE.Vector2(-100, 0), new THREE.Vector2(0, 30), new THREE.Vector2(100, 0)];
// 二维样条曲线
// const curve = new THREE.SplineCurve(arr);

// 从曲线上获取顶点坐标
const pointsArr = curve.getPoints(50);

// 创建没有任何形状的空几何体
const geometry = new THREE.BufferGeometry();

// 把曲线上获取的顶点坐标赋值给几何体对象
geometry.setFromPoints(pointsArr);

// 创建线材质
const material = new THREE.LineBasicMaterial({
    color: 0x00ffff
});

// 创建线模型
const line = new THREE.Line(geometry, material);

// 用点模型可视化样条曲线经过的顶点位置
const geometryPoints = new THREE.BufferGeometry();
geometryPoints.setFromPoints(arr);

const materialPoints = new THREE.PointsMaterial({
    color: 0xff00ff,
    size: 10
});

const points = new THREE.Points(geometryPoints, materialPoints);

const group = new THREE.Group();
group.add(line, points);

export default group;